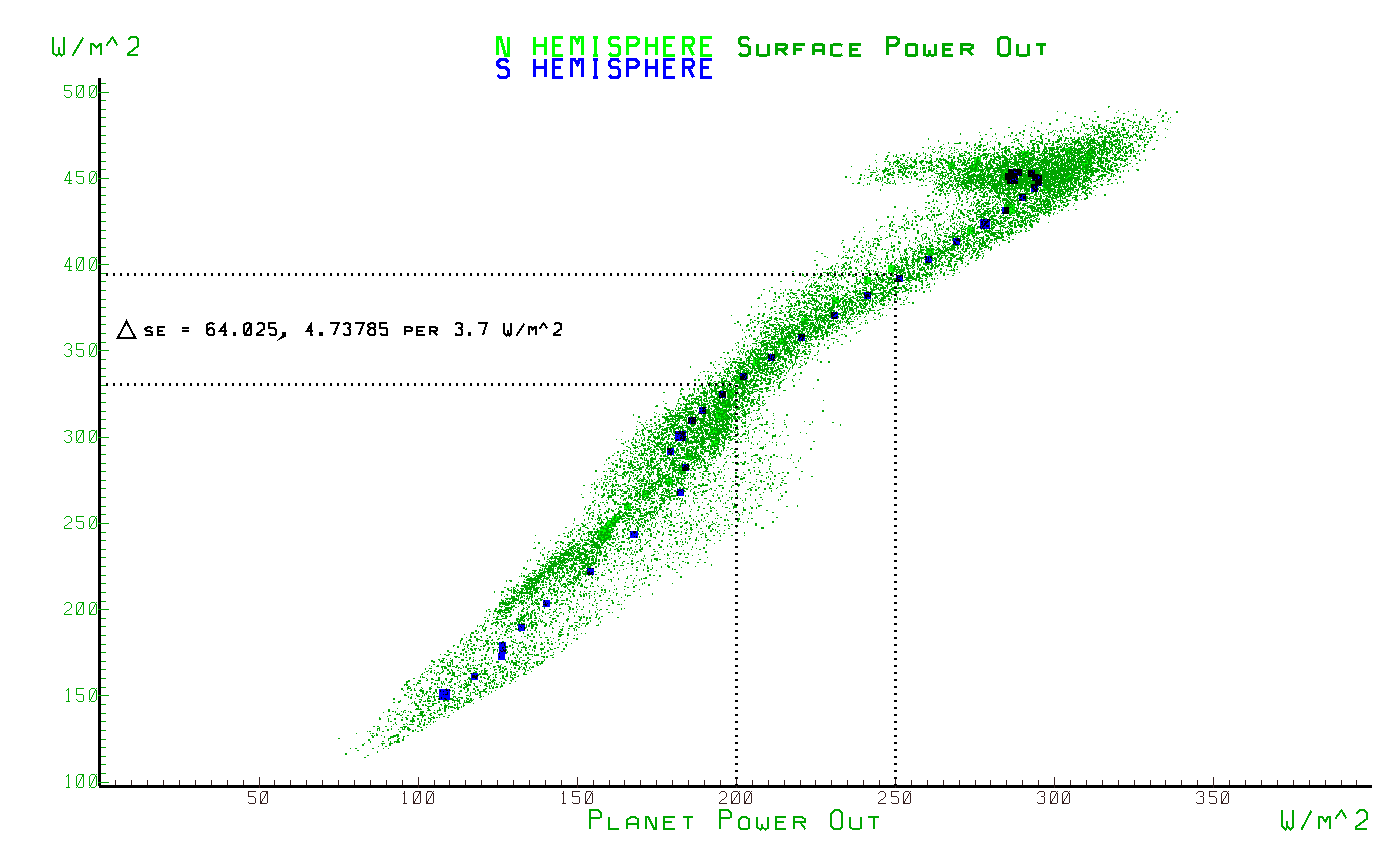
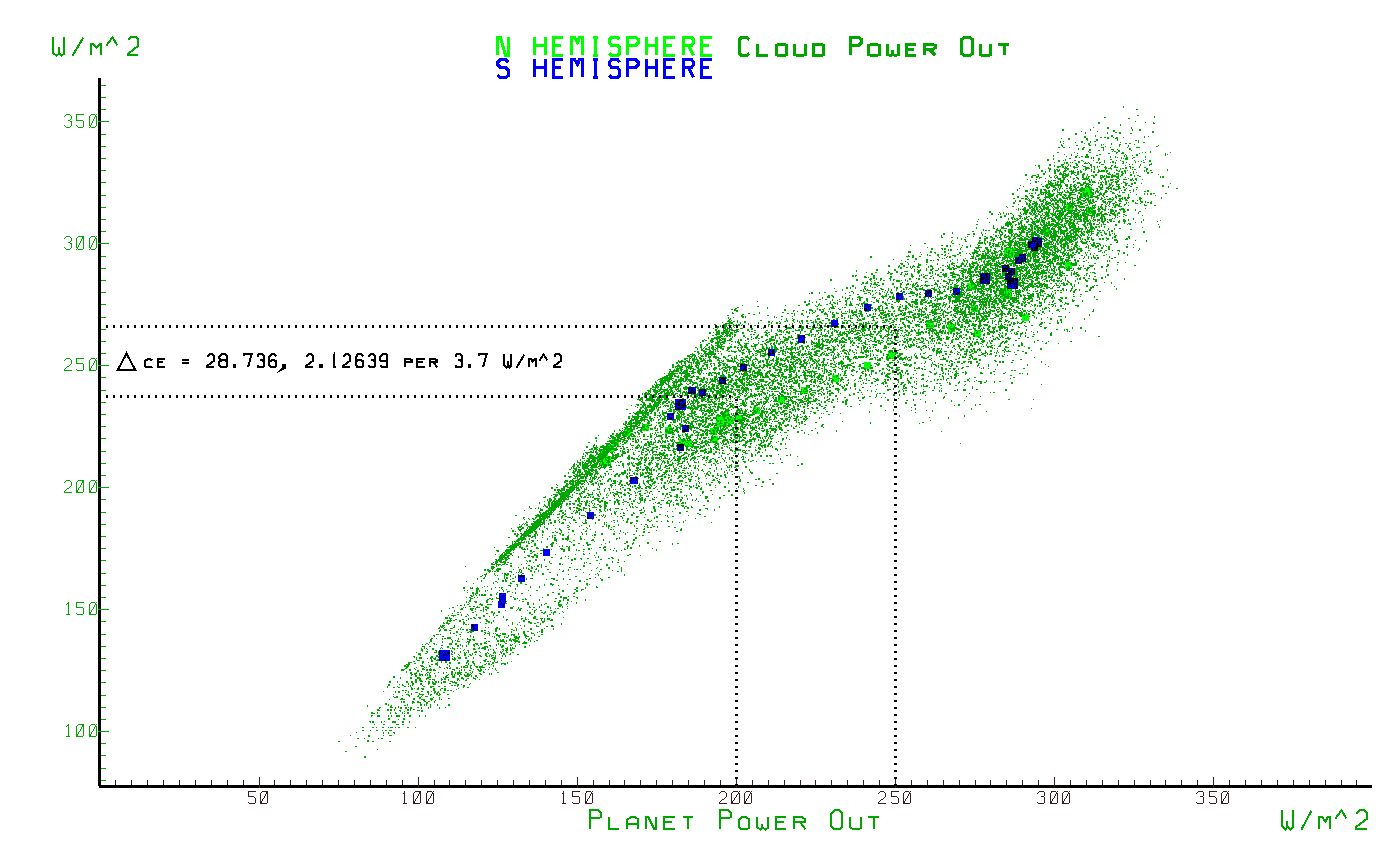
These are plots of several climate variables vs. the planet power output (the total emissions leaving the planet). The different variables plotted against PO are,
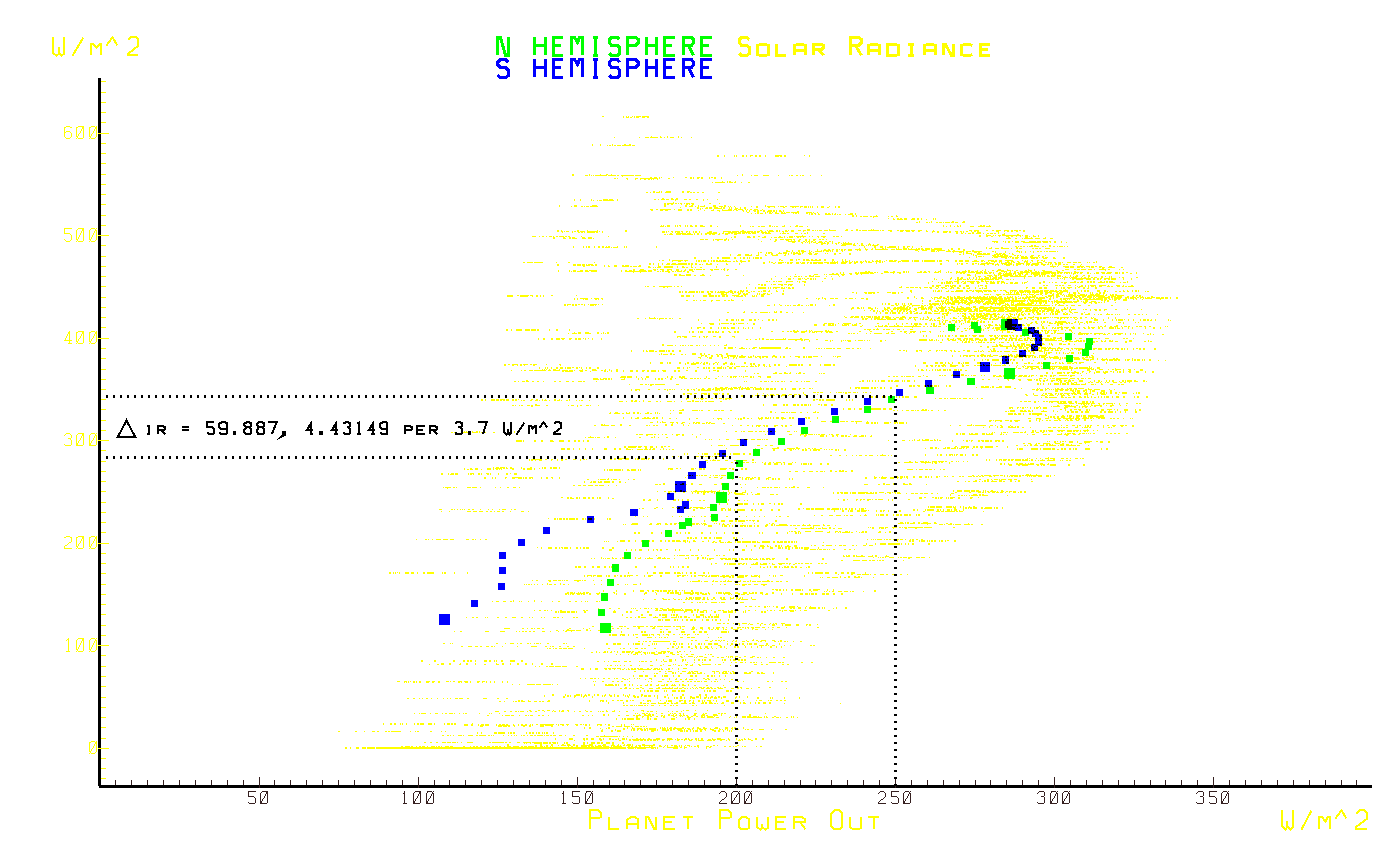
solar power in vs. planet power out
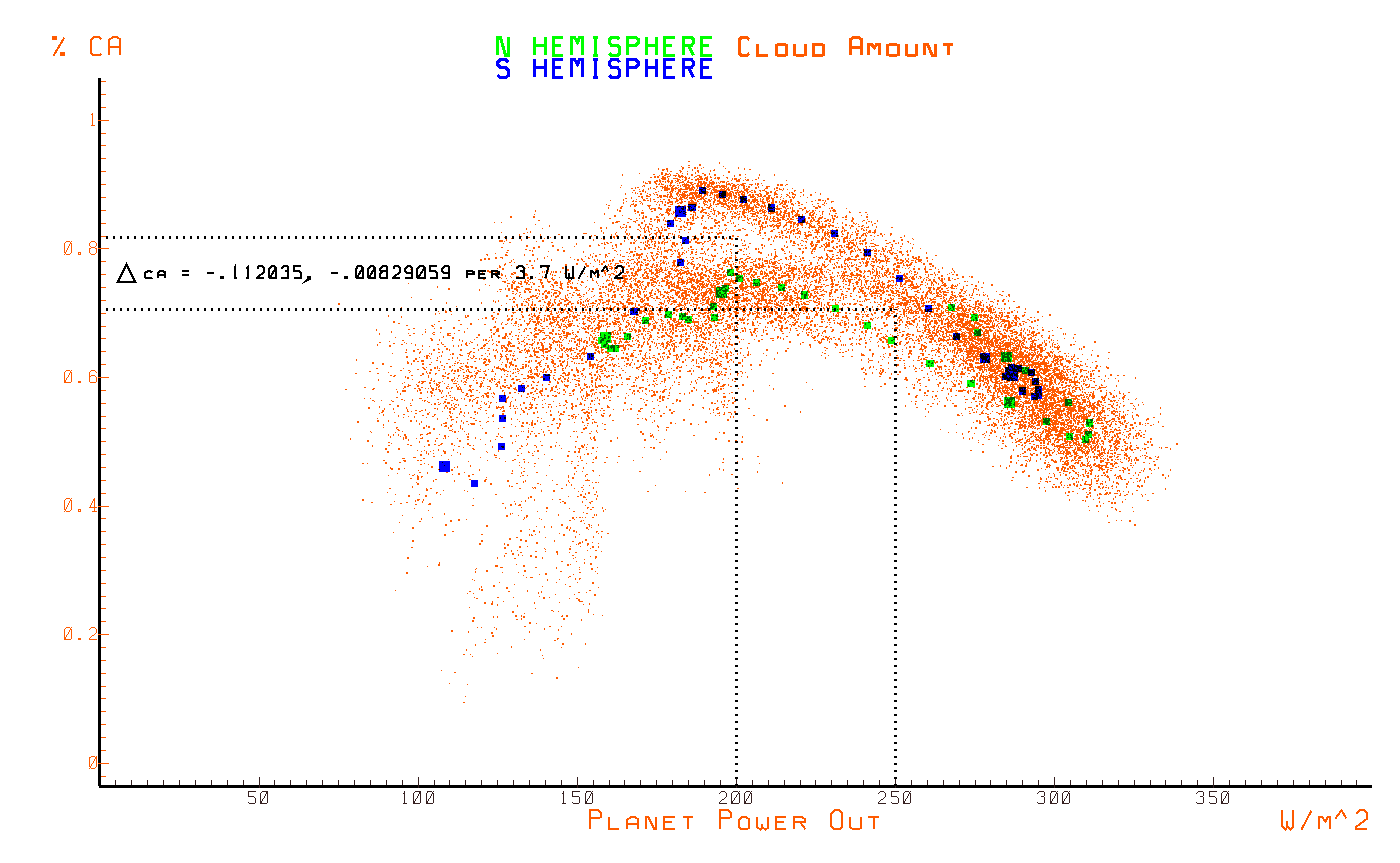
surface fraction covered by clouds vs. planet power out
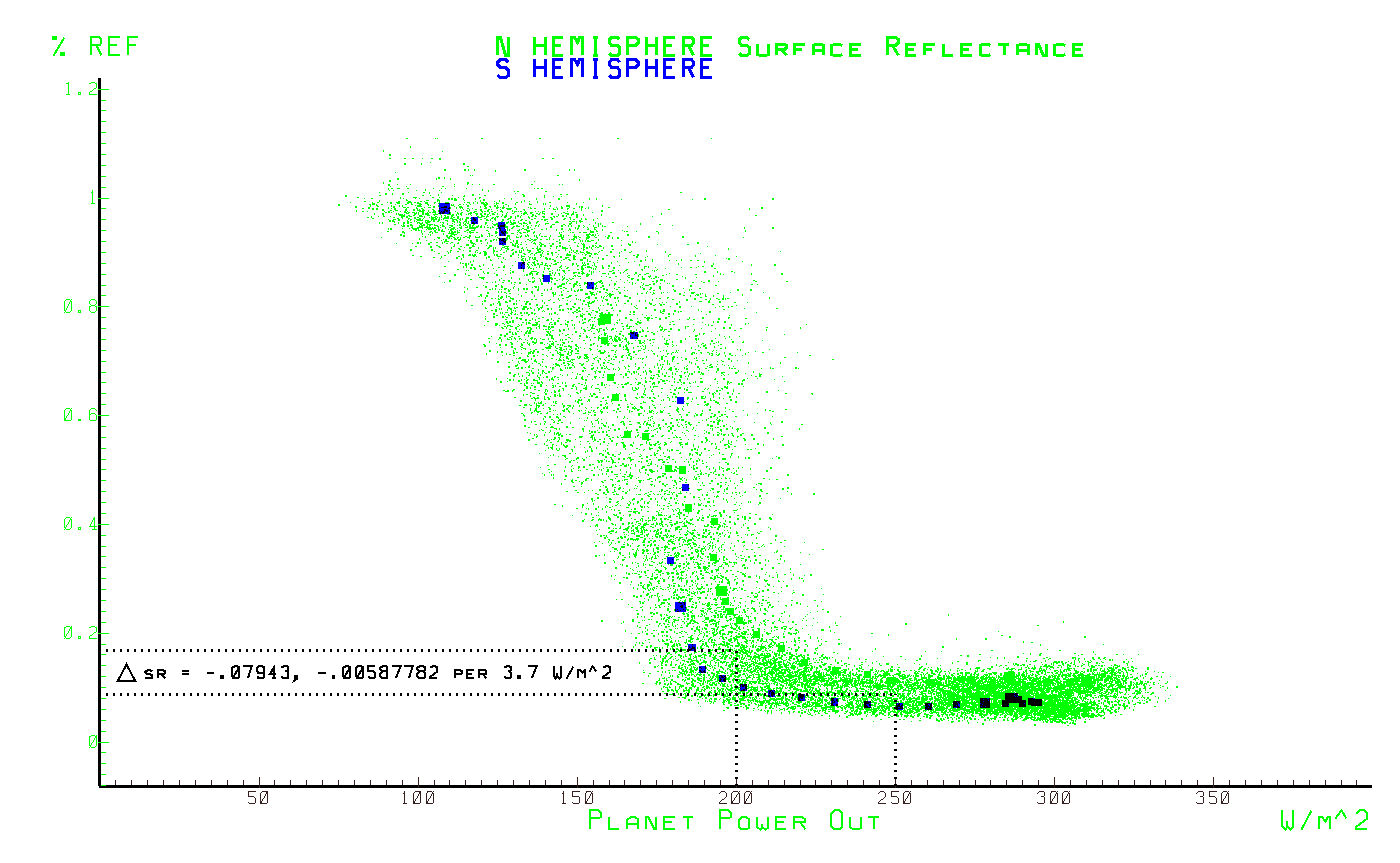
surface reflectivity vs. planet power out
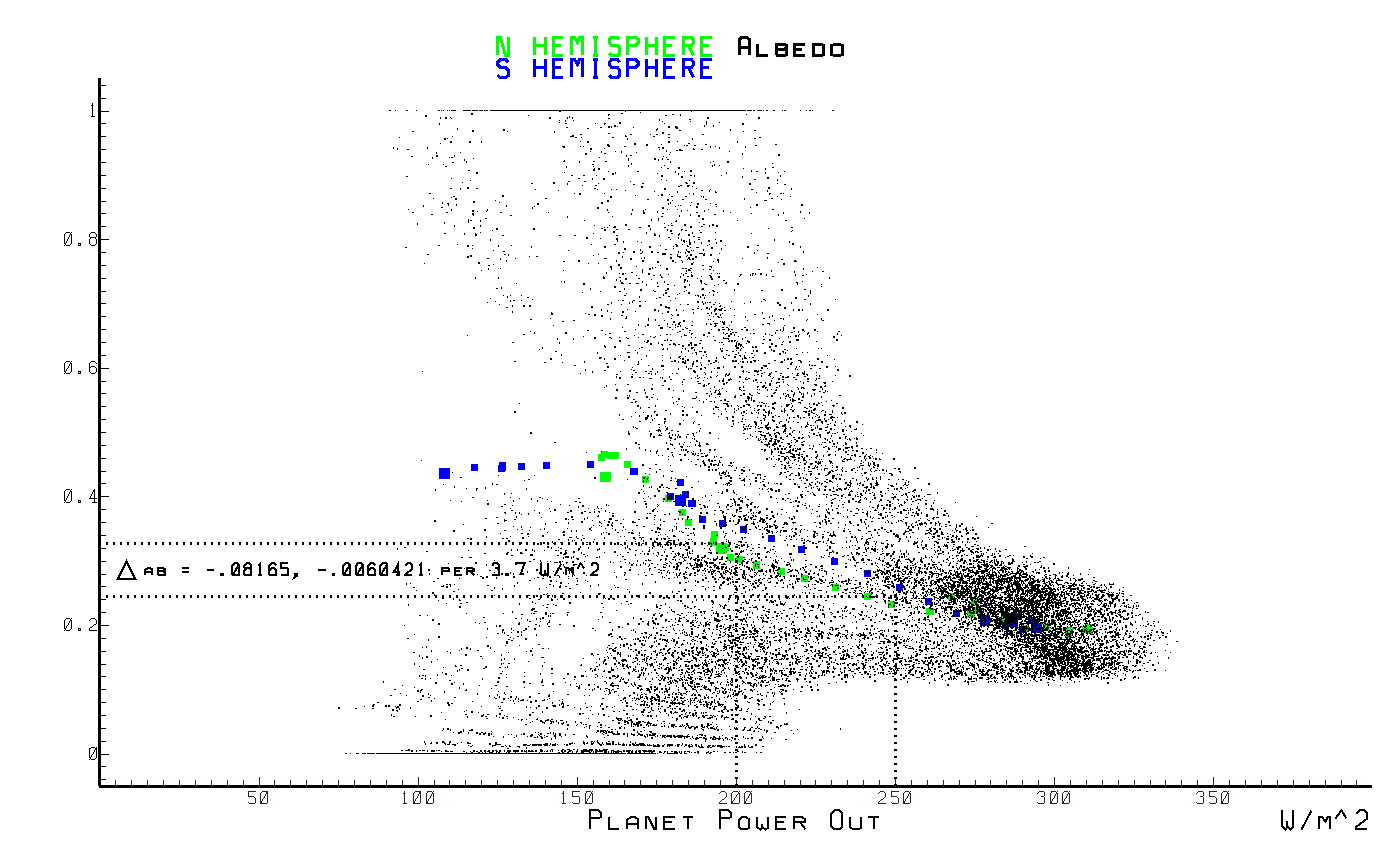
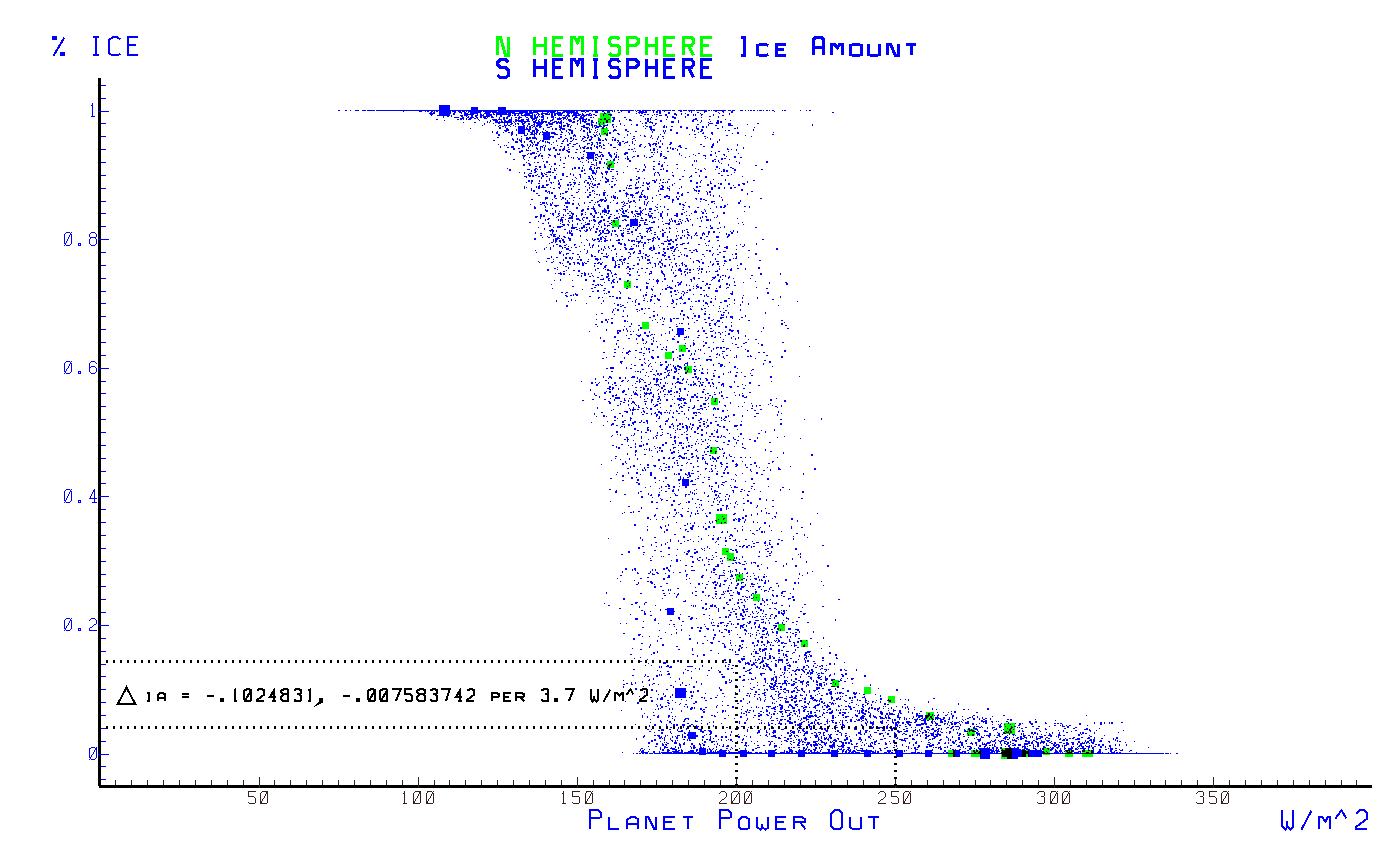
ice amount vs. planet power out
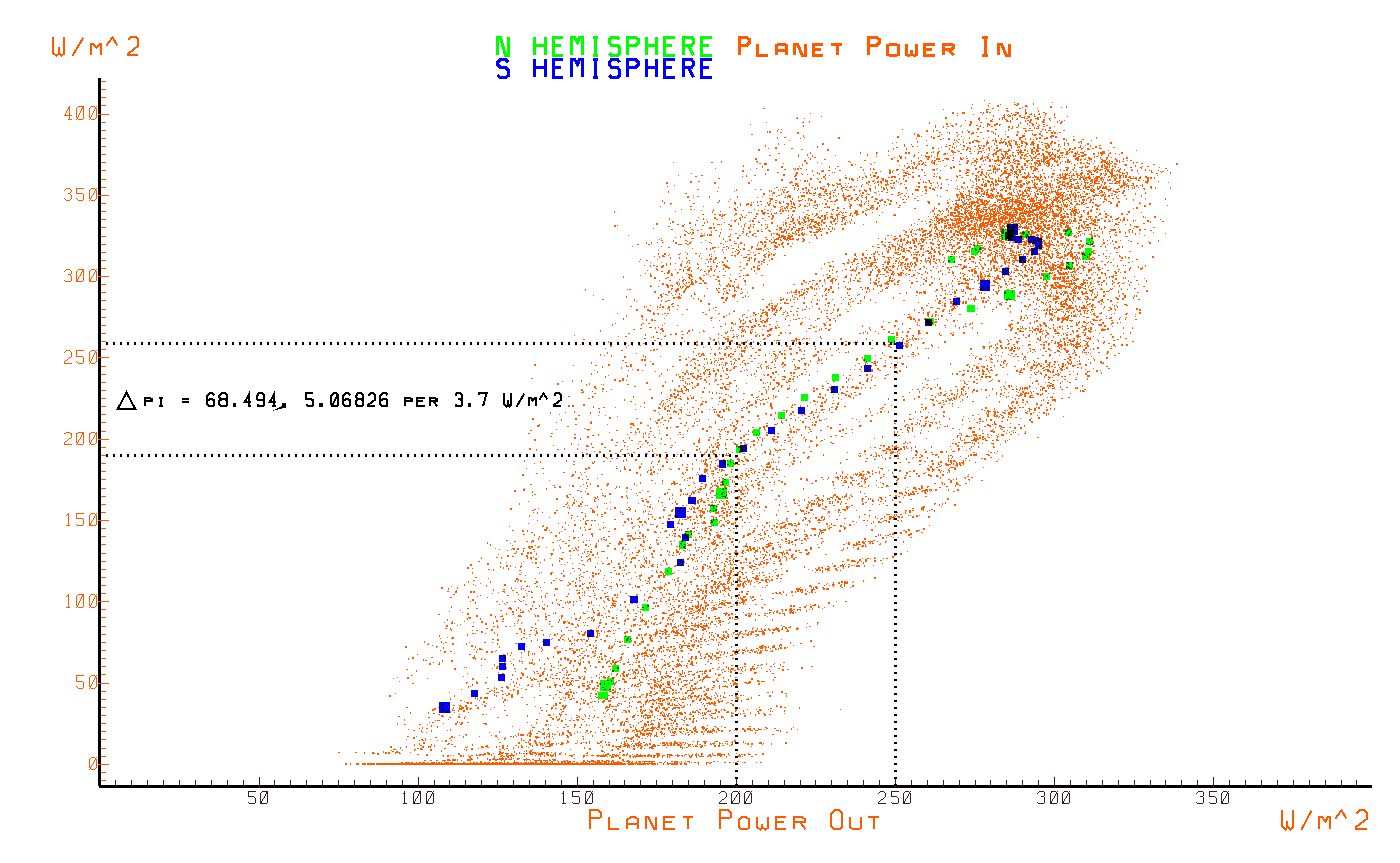
planet power in vs. planet power out
sensible heat vs. planet power out
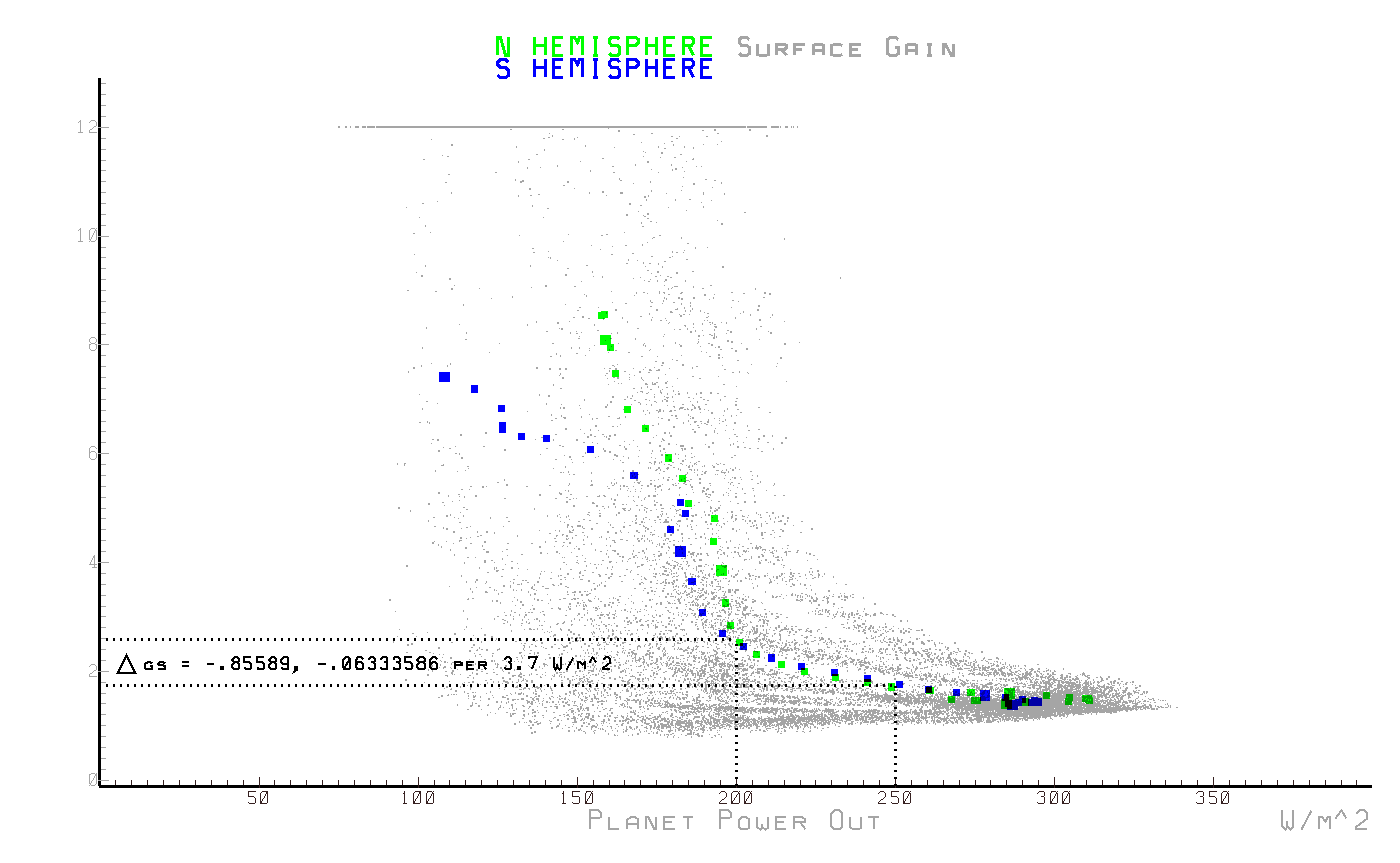
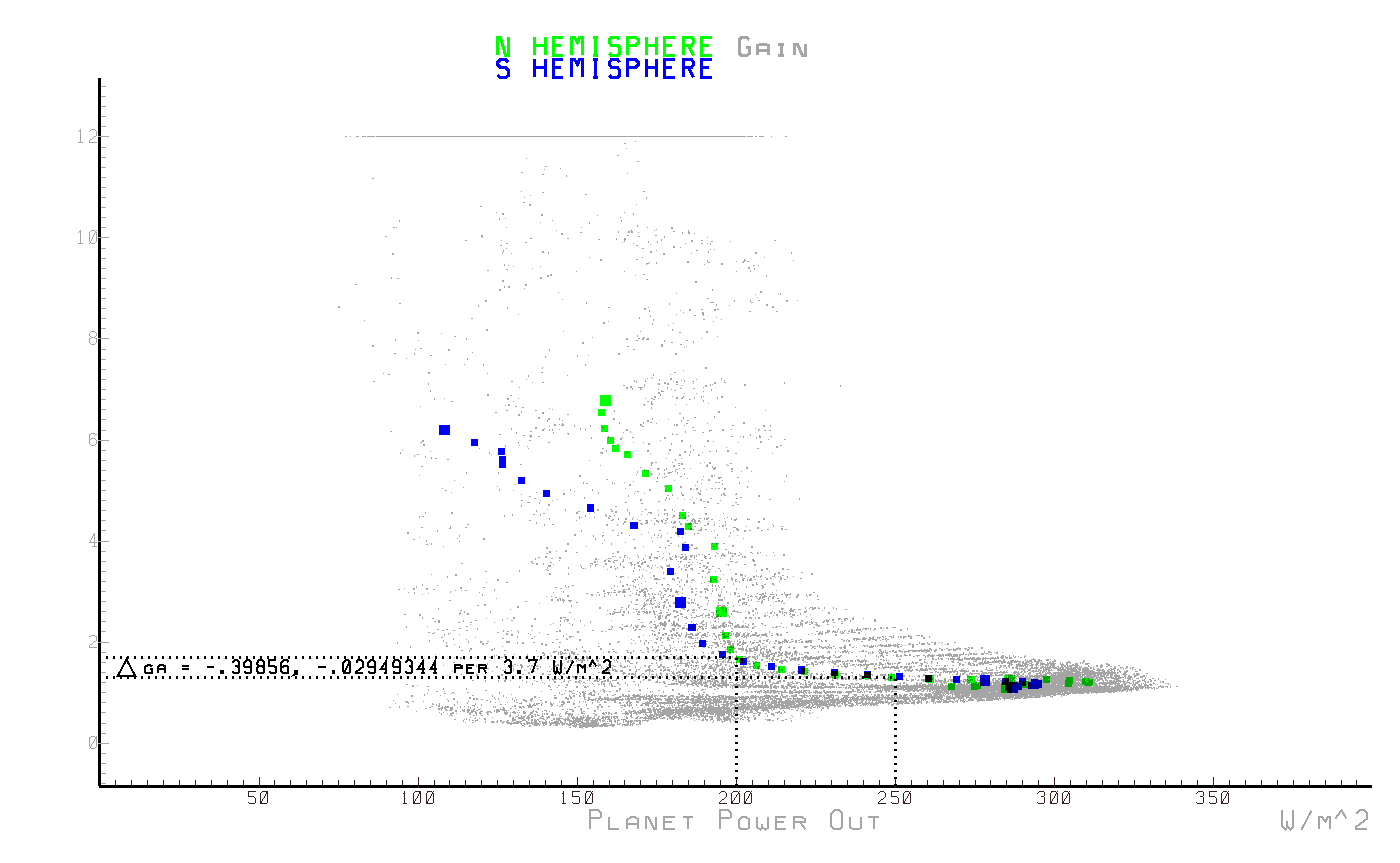
surface gain vs. planet power out
system gain vs. planet power out
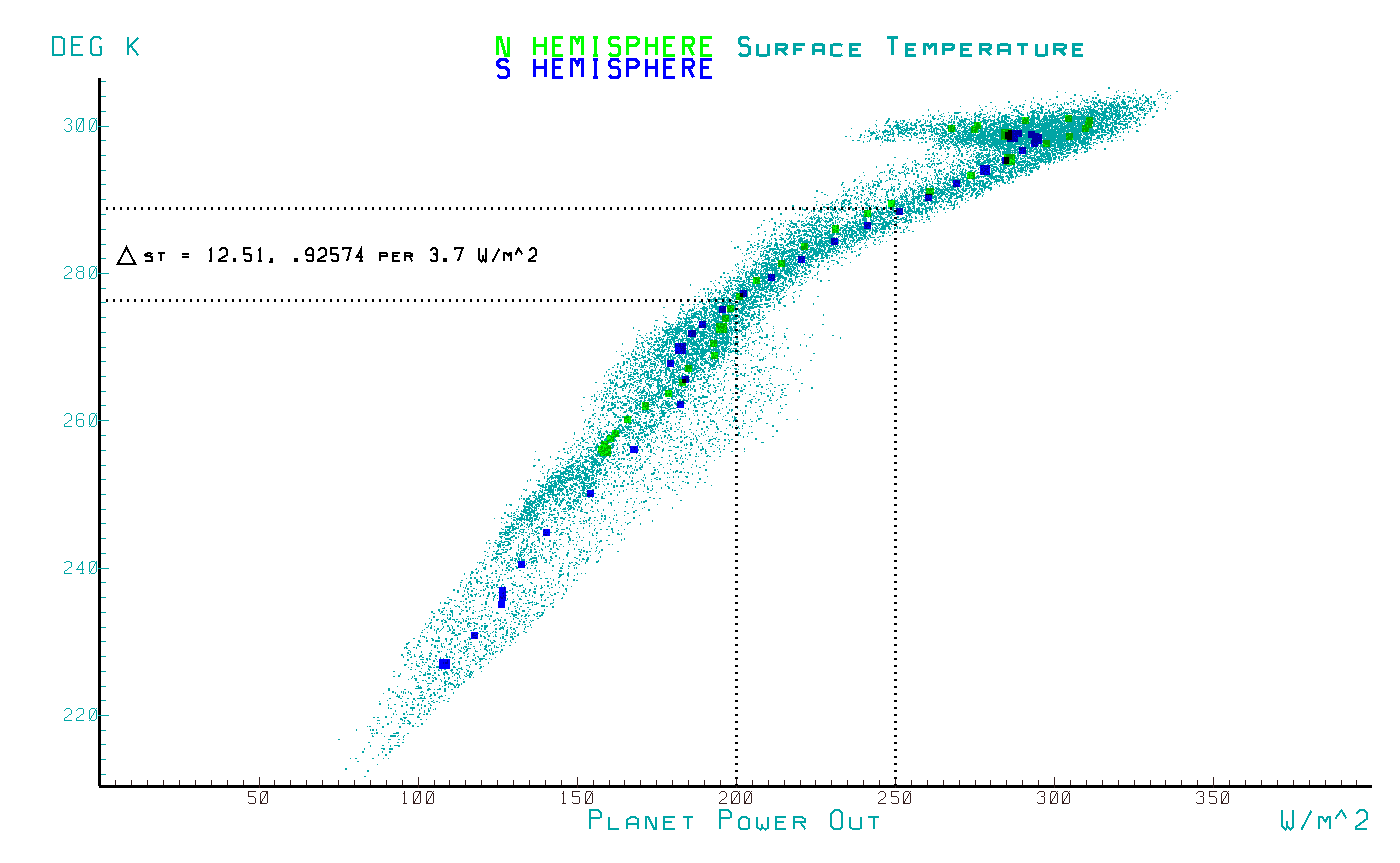
surface temperature vs. planet power out
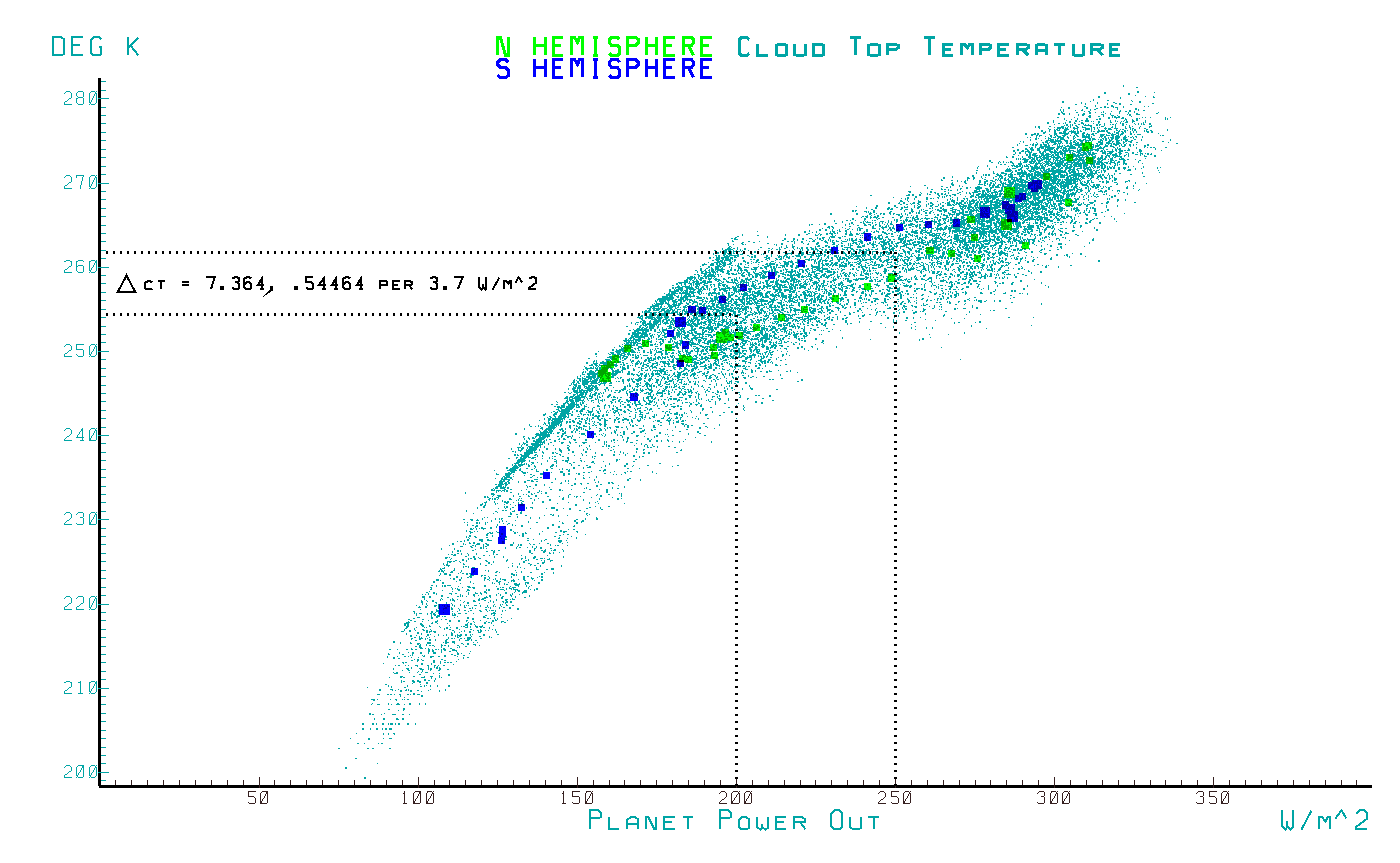
cloud temperature vs. planet power out
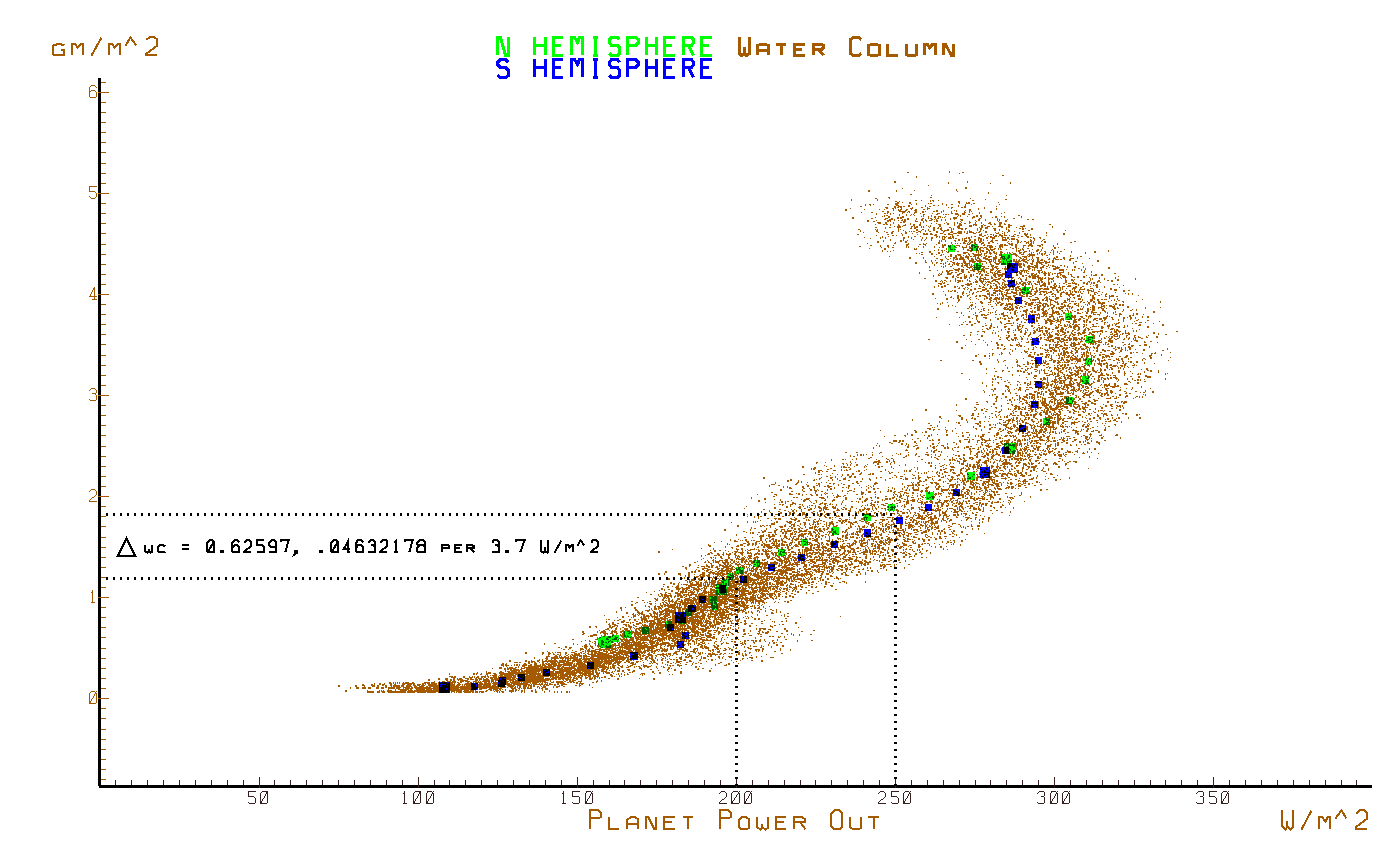
water column vs. planet power out