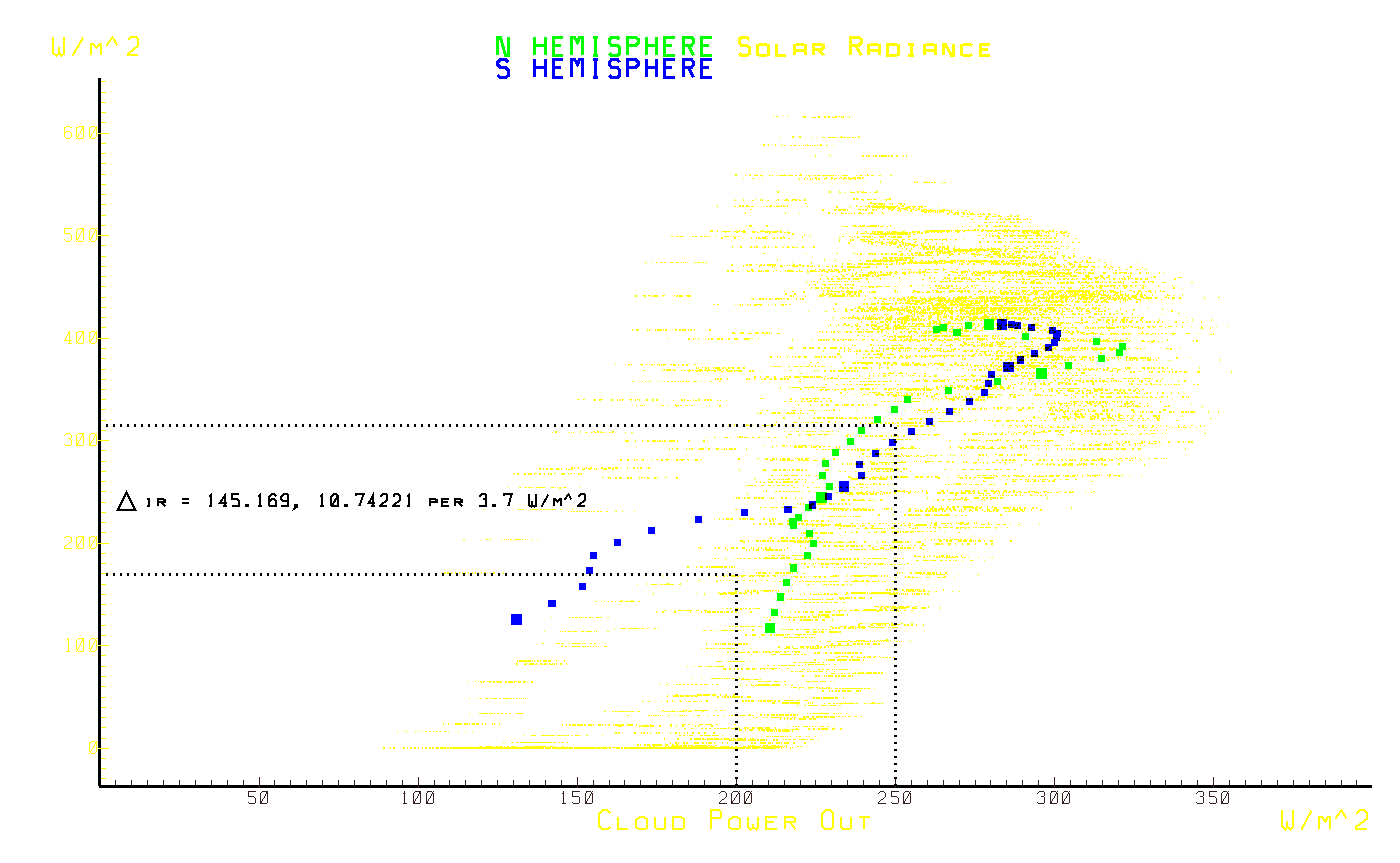
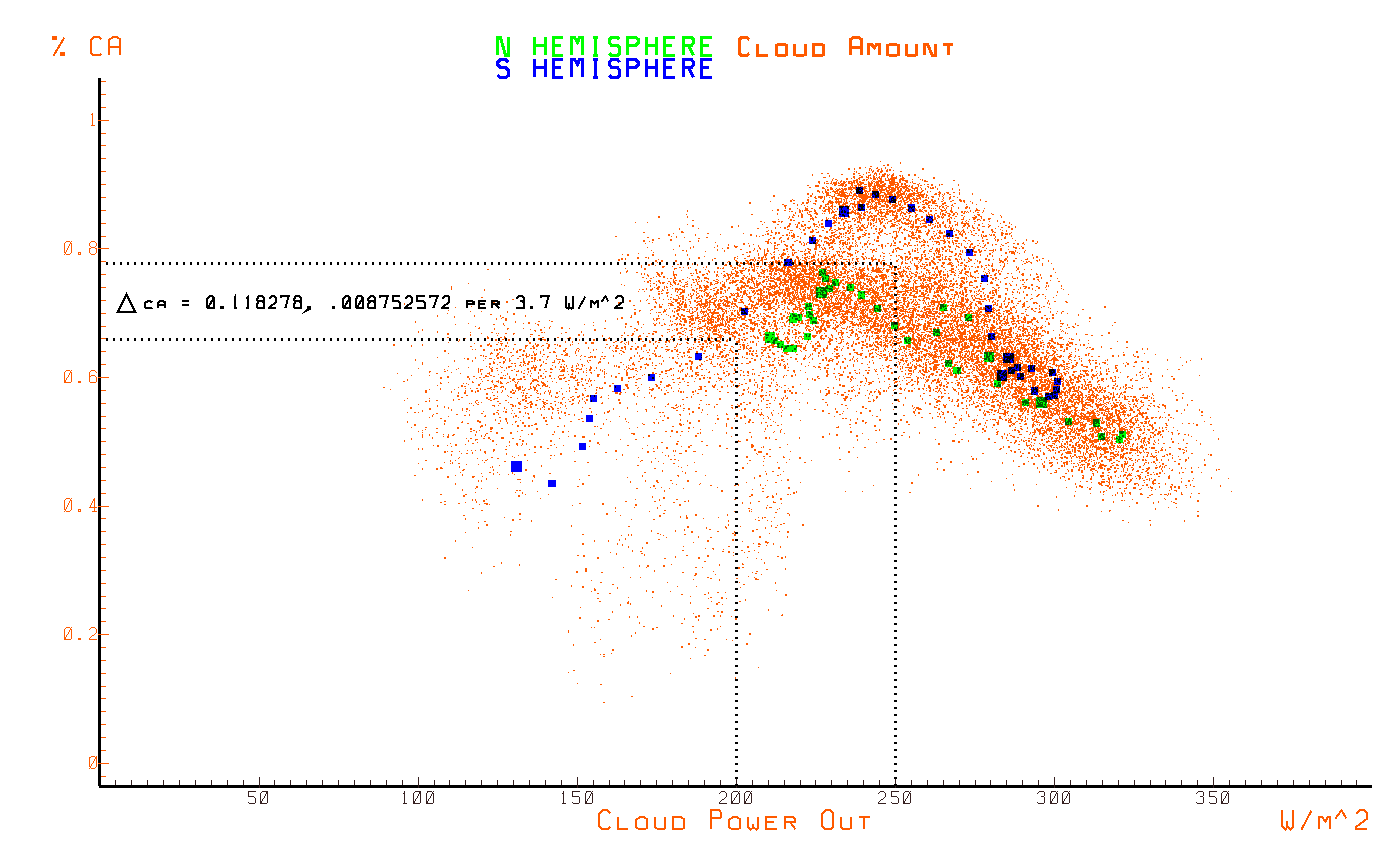
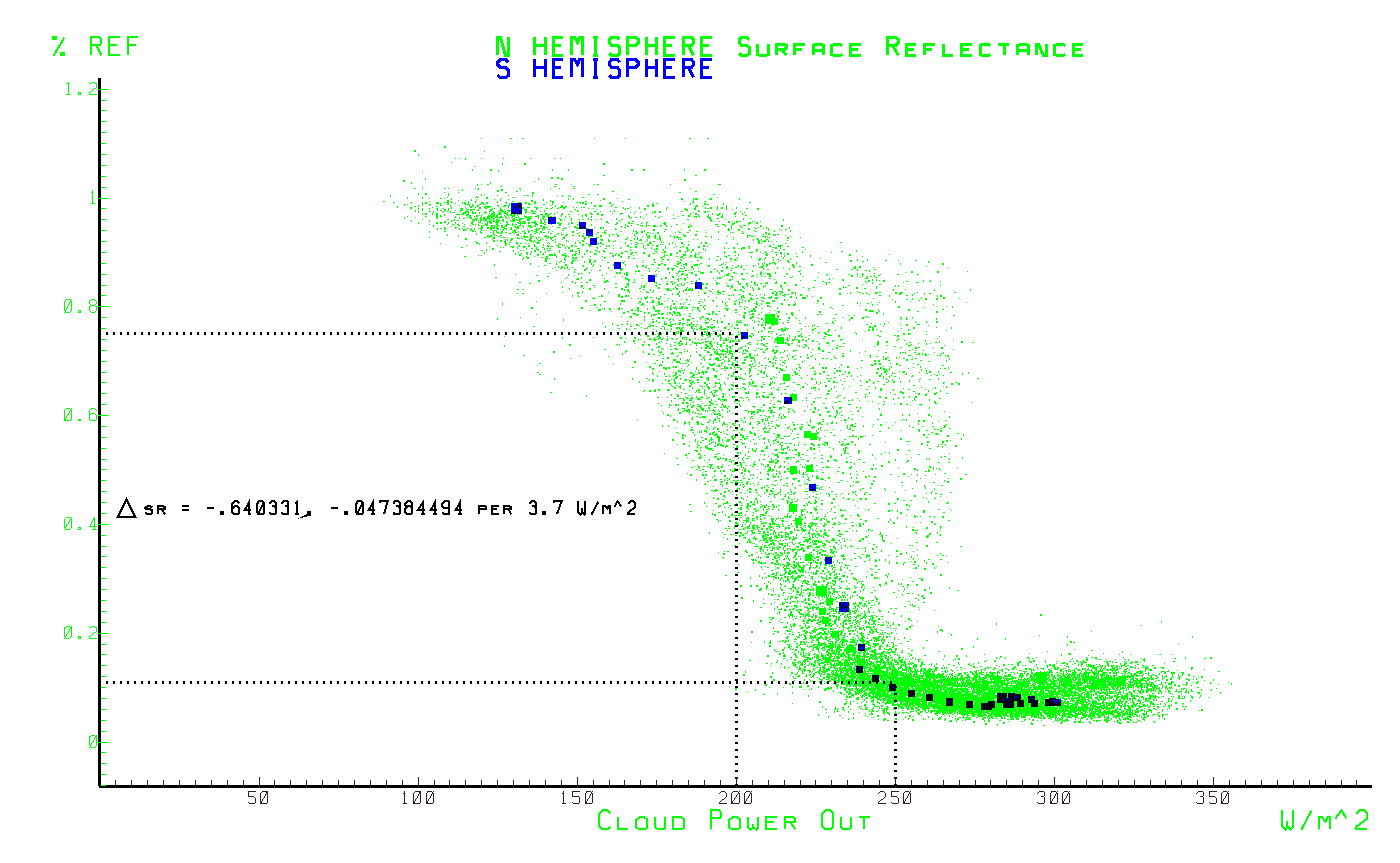
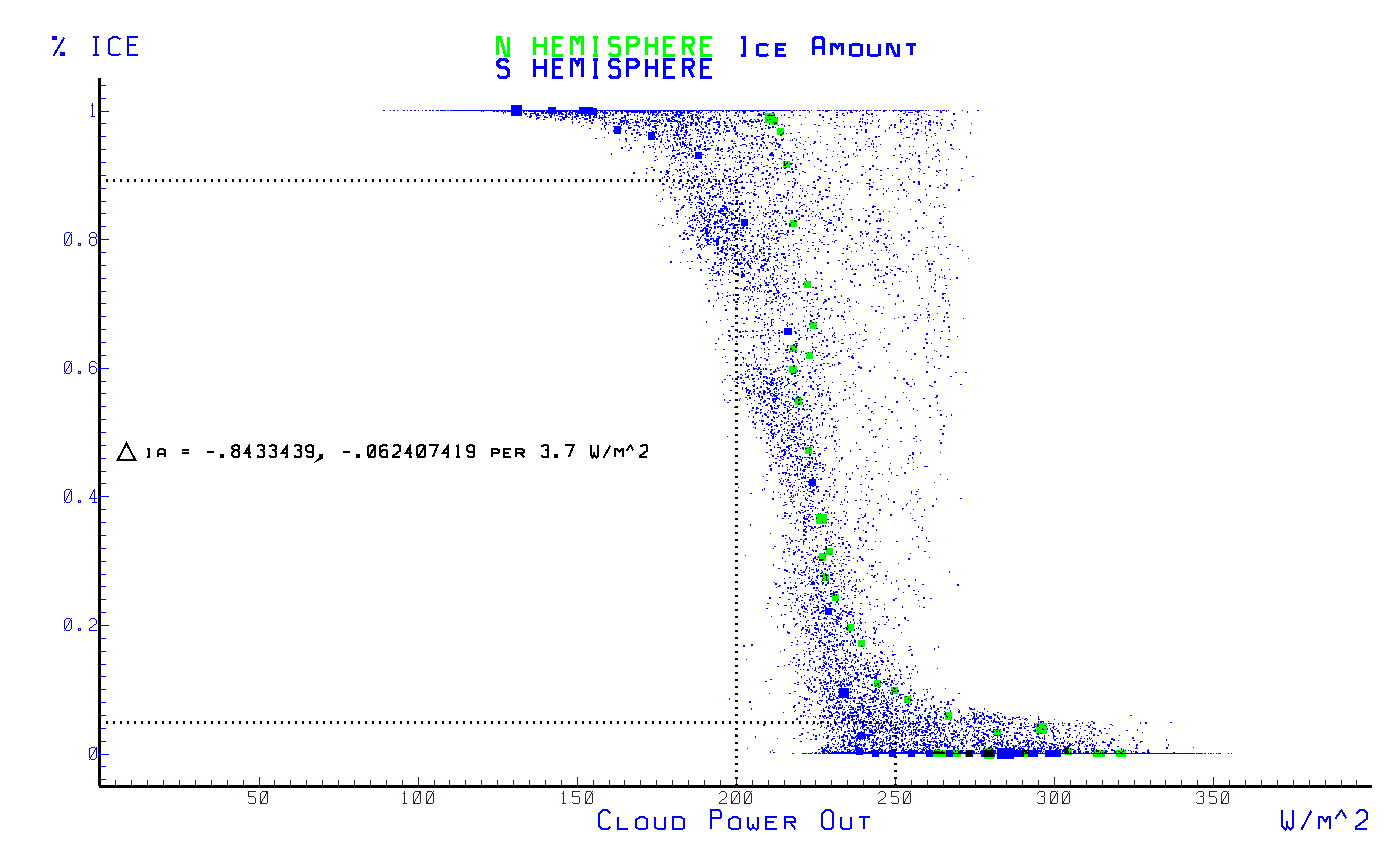
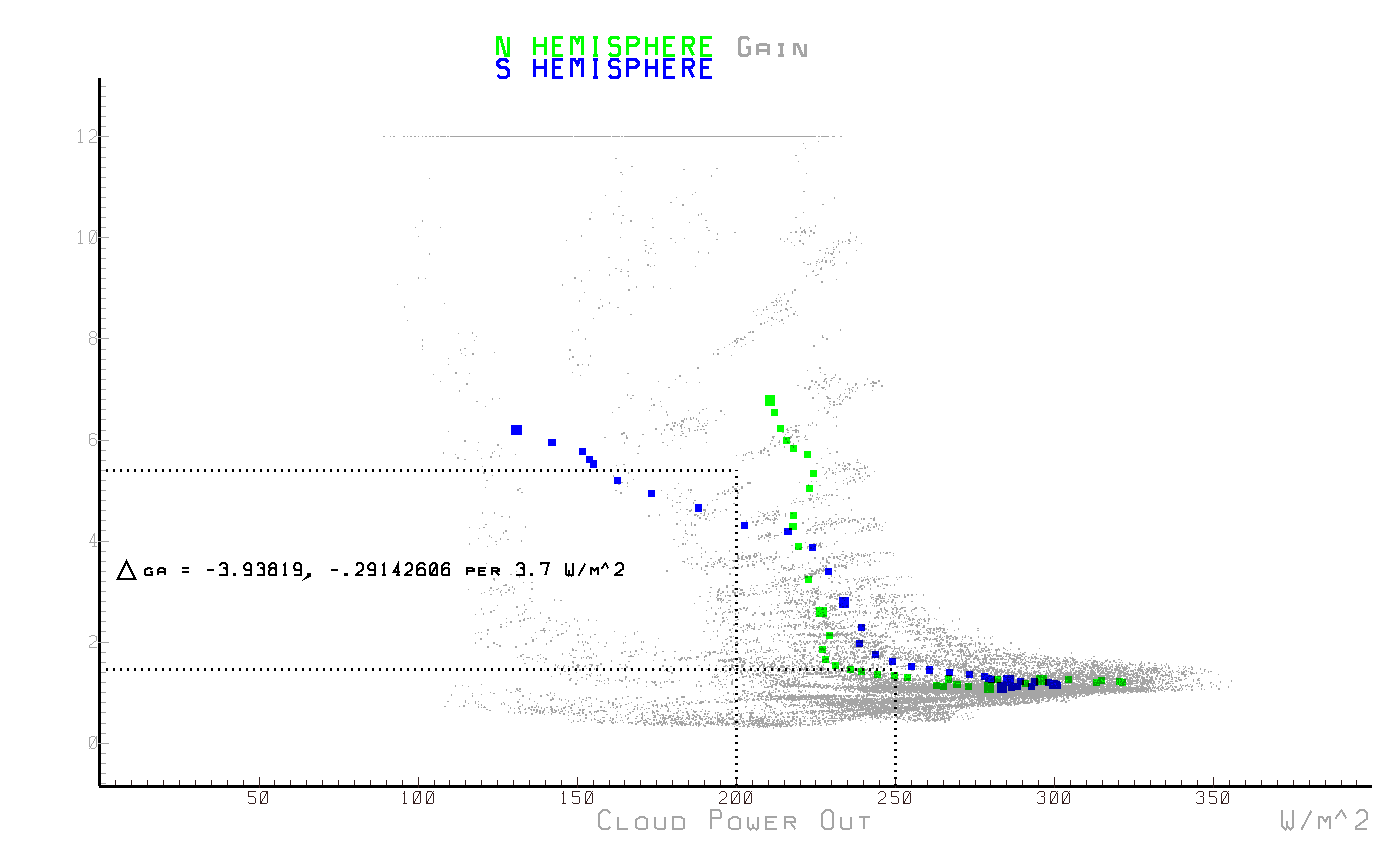
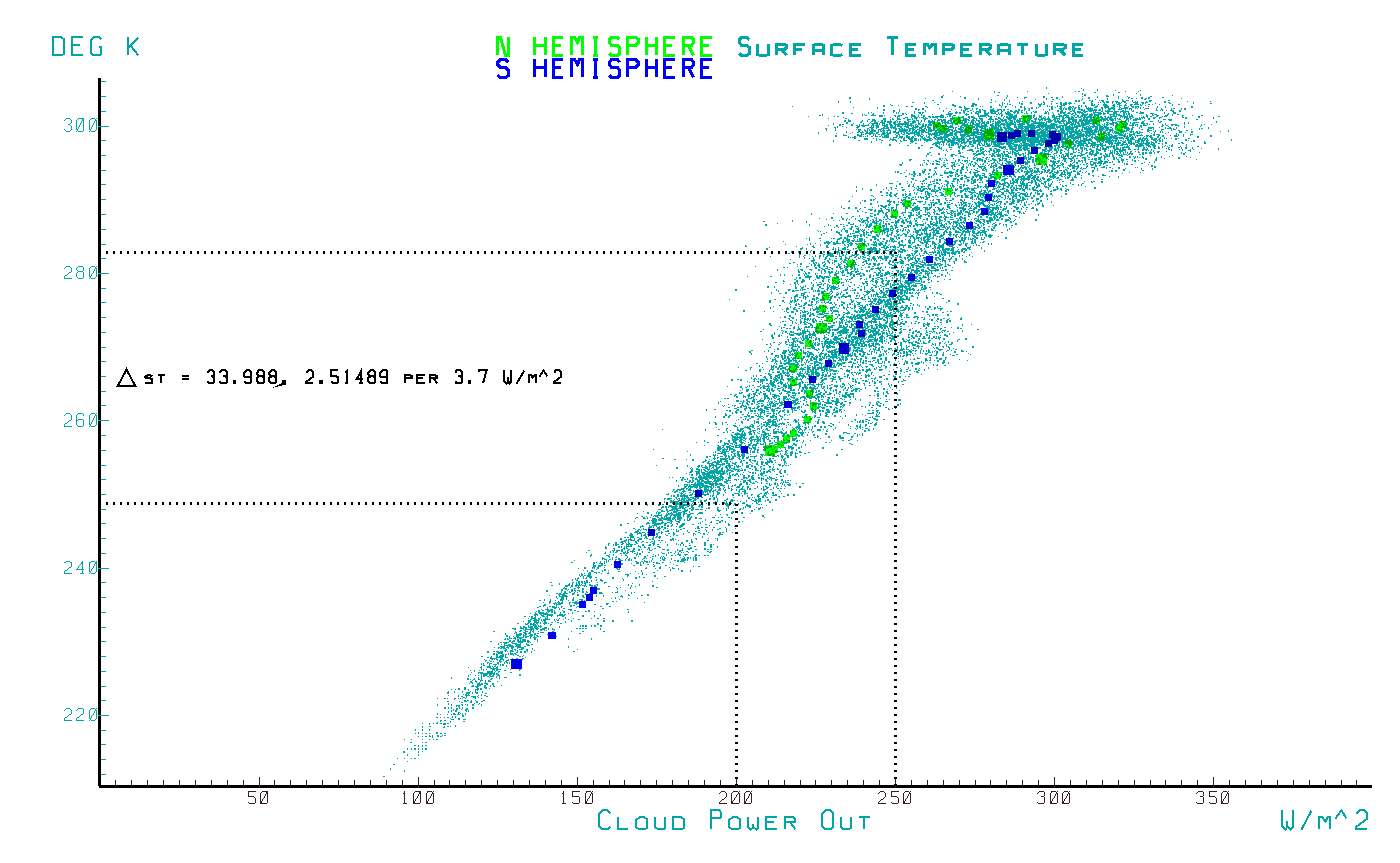
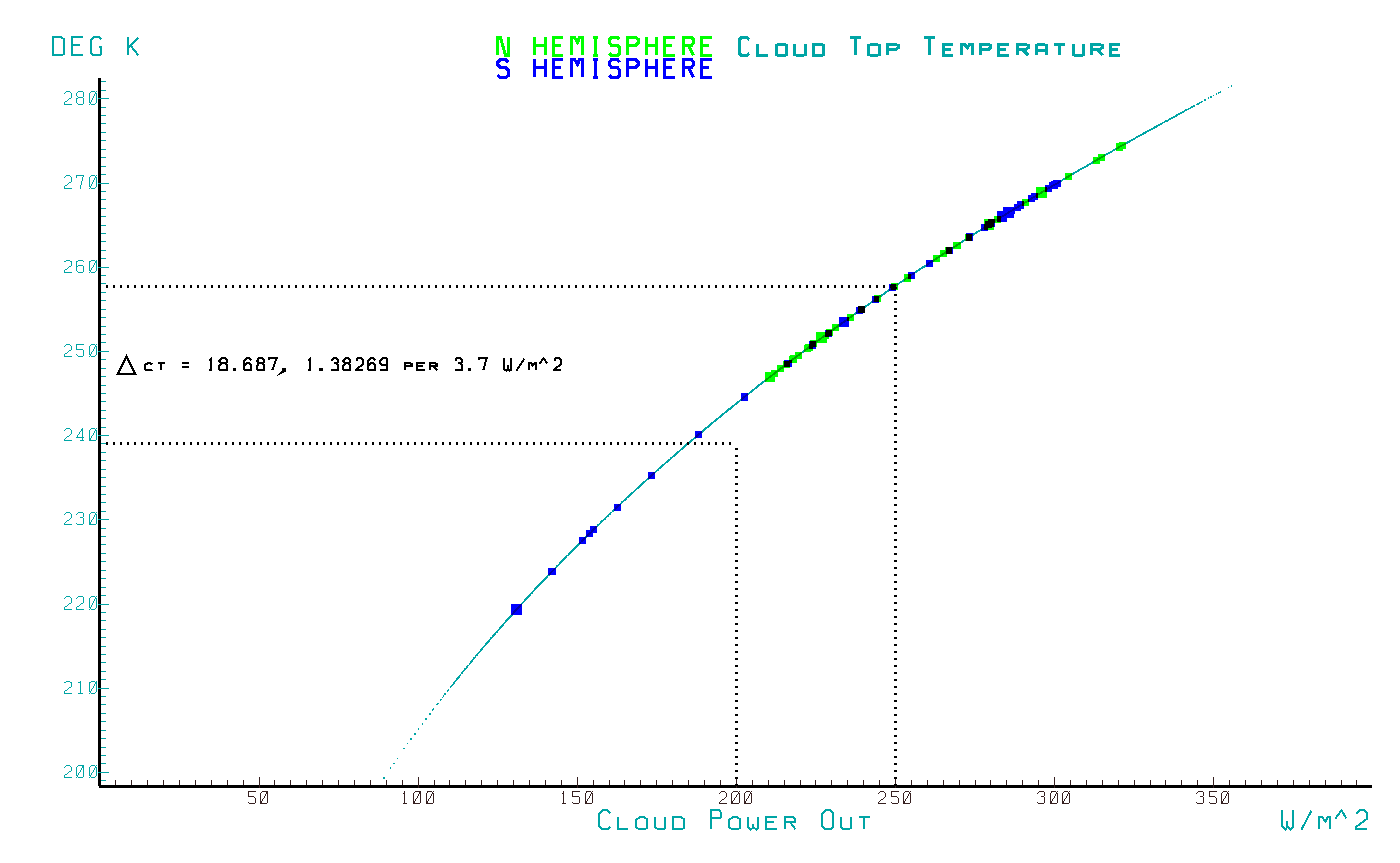
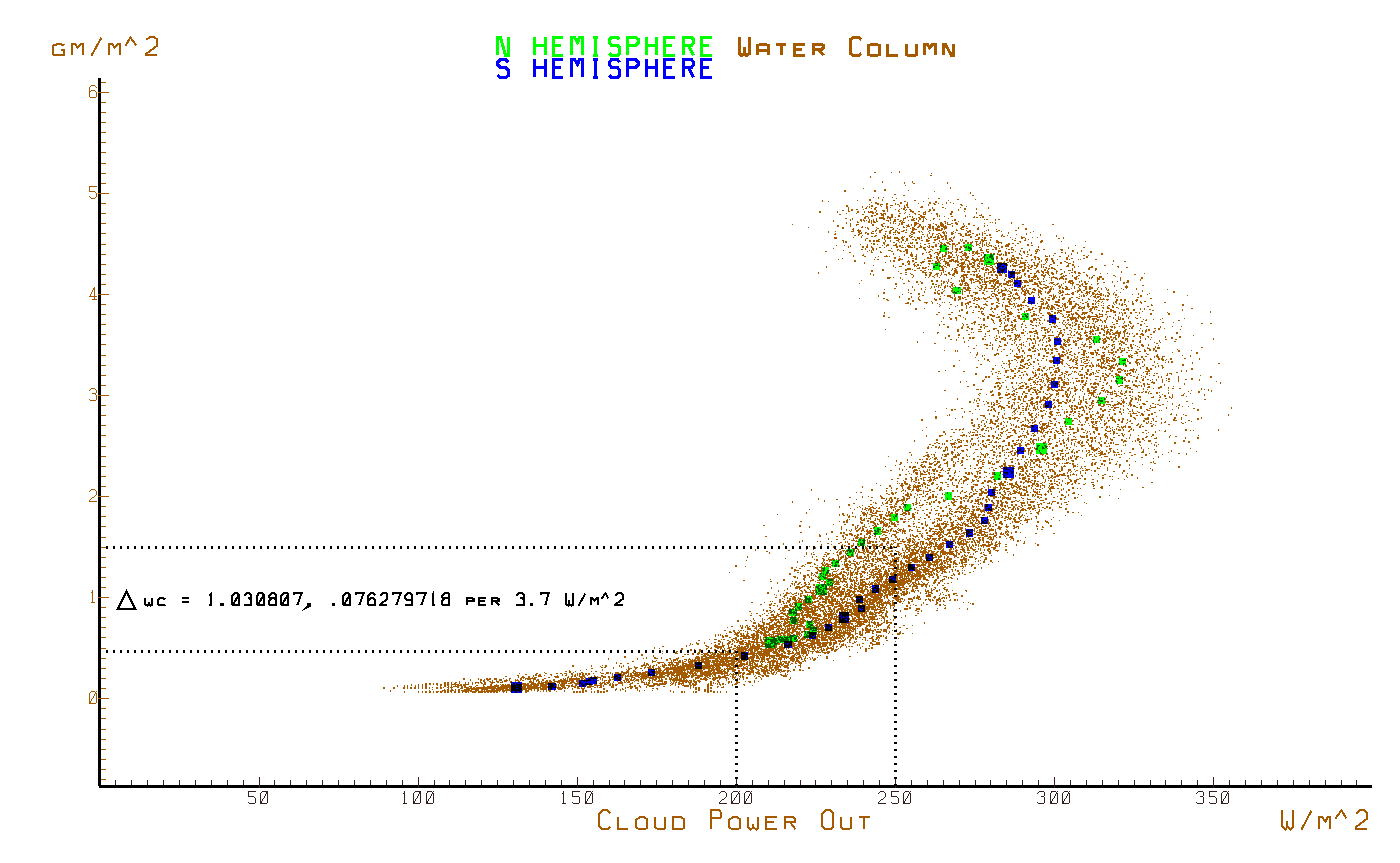
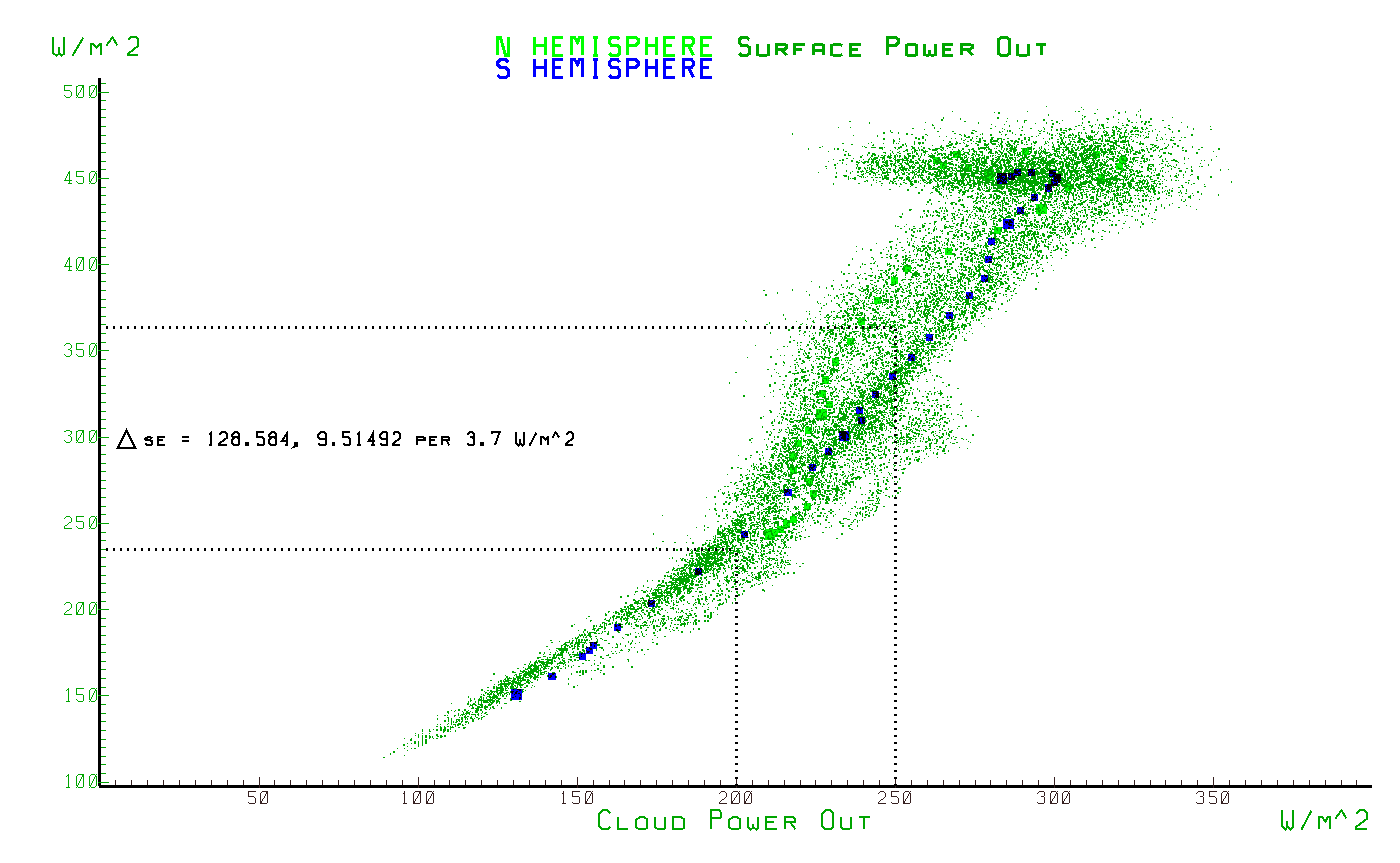
These are plots of several climate variables vs. the power emitted by clouds consequential to cloud top temperatures. The different variables plotted against CE are,
solar power in vs. cloud emitted power
surface fraction covered by clouds vs. cloud emitted power
surface reflectivity vs. cloud emitted power
albedo vs. cloud emitted power
ice amount vs. cloud emitted power
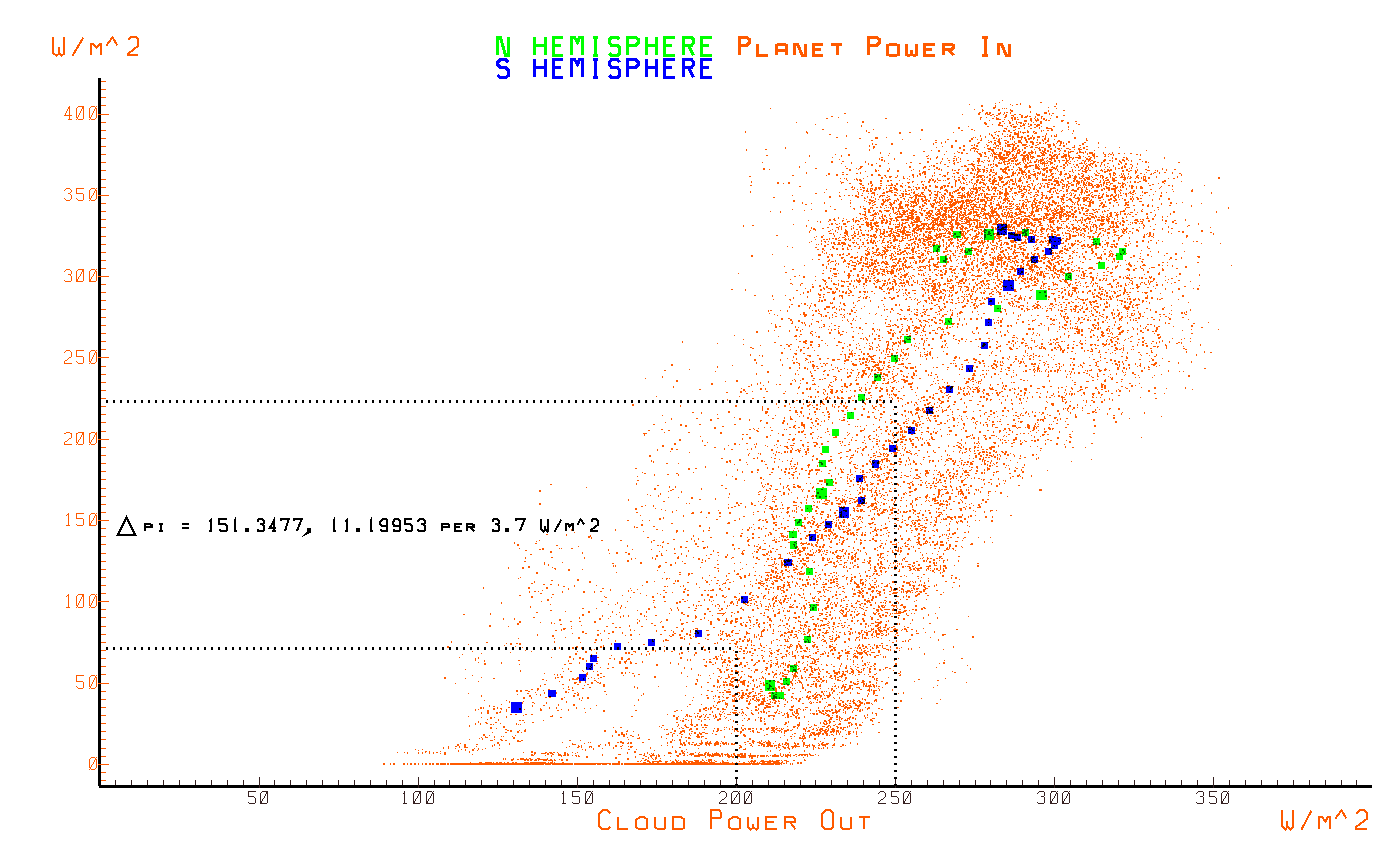
planet power in vs. cloud emitted power
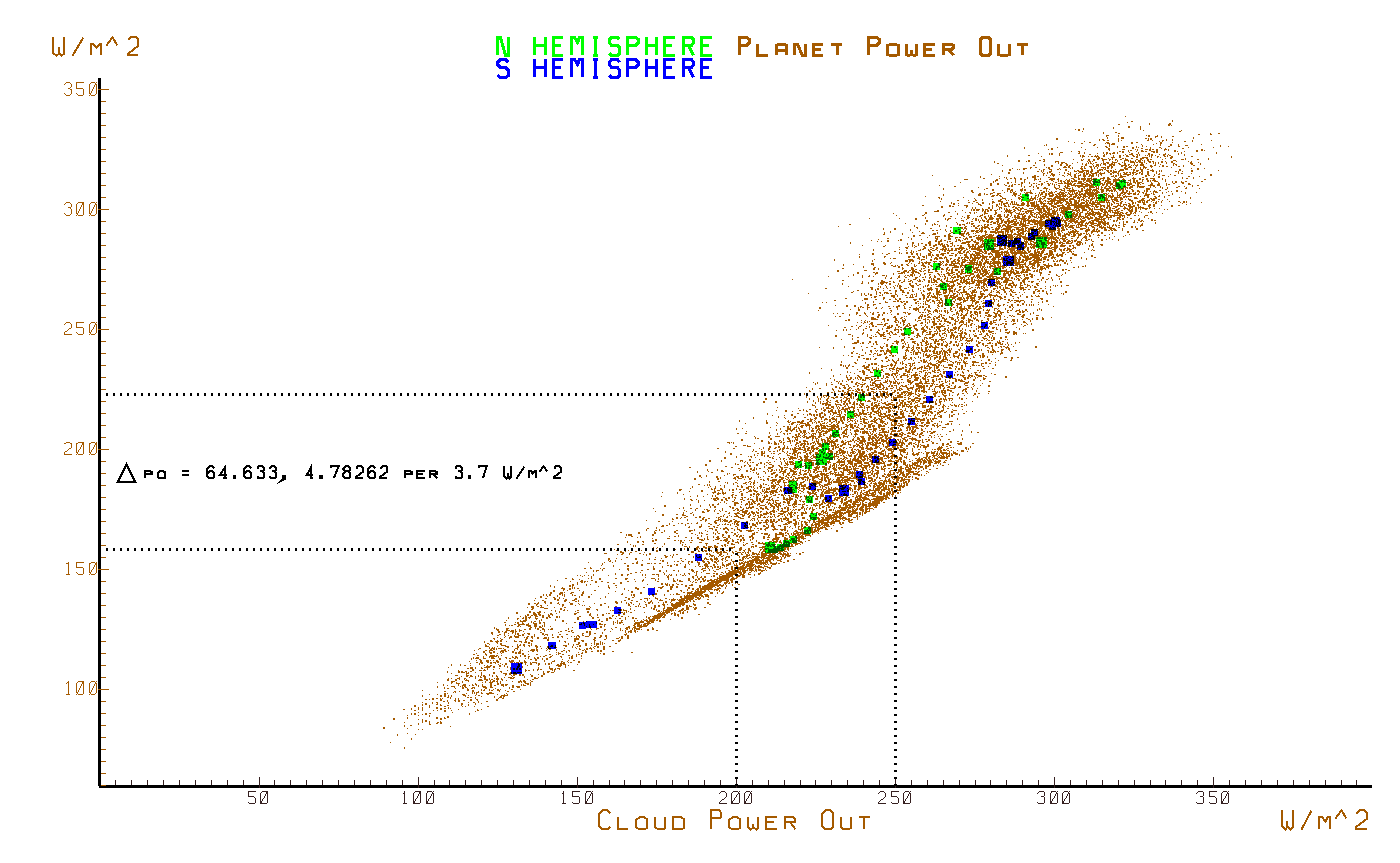
planet power out vs. cloud emitted power
sensible heat vs. cloud emitted power
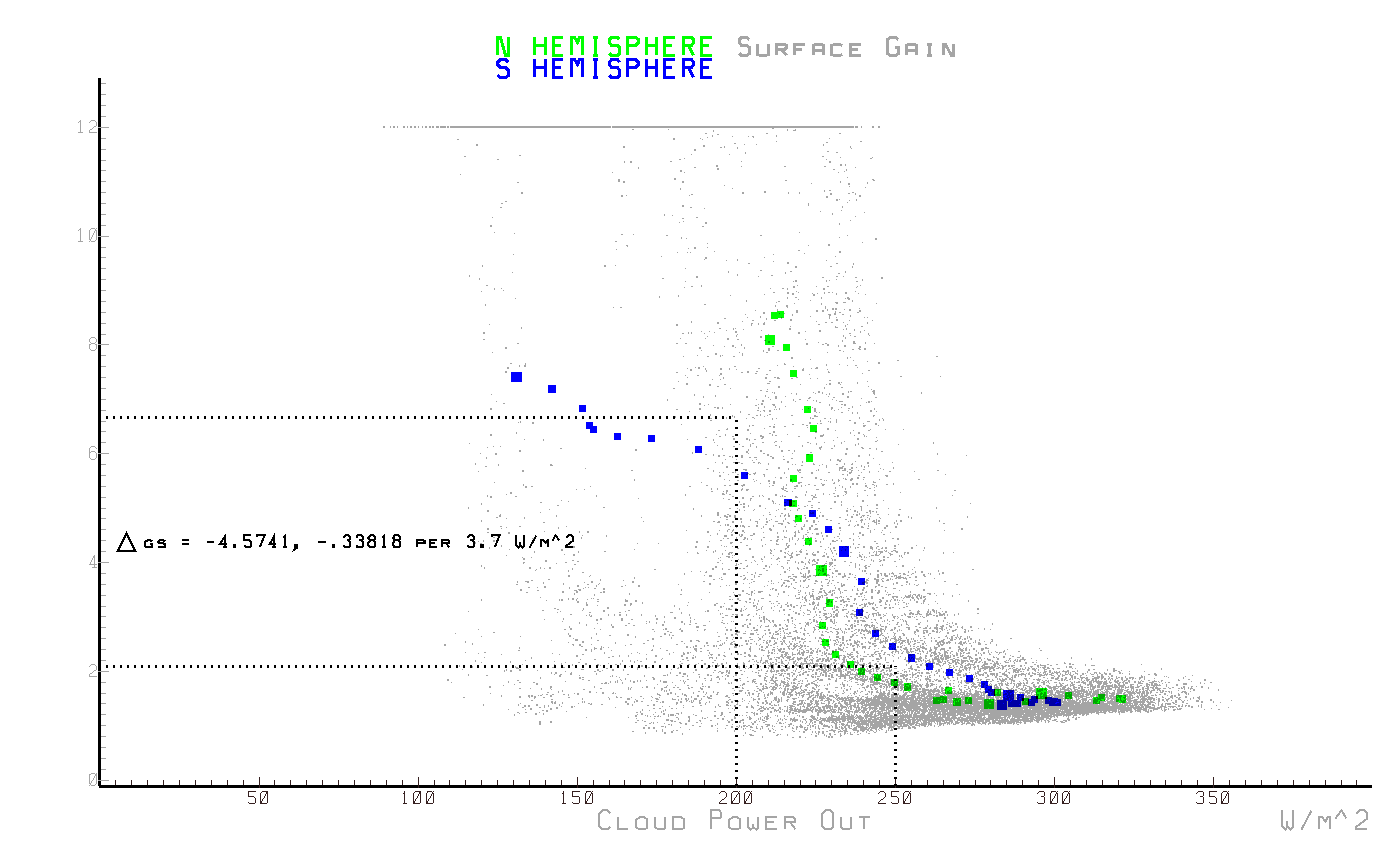
surface gain vs. cloud emitted power
system gain vs. cloud emitted power
surface temperature vs. cloud emitted power
cloud temperature vs. cloud emitted power